Plots a tbl_graph object containing pairwise correlations as a network.
Examples
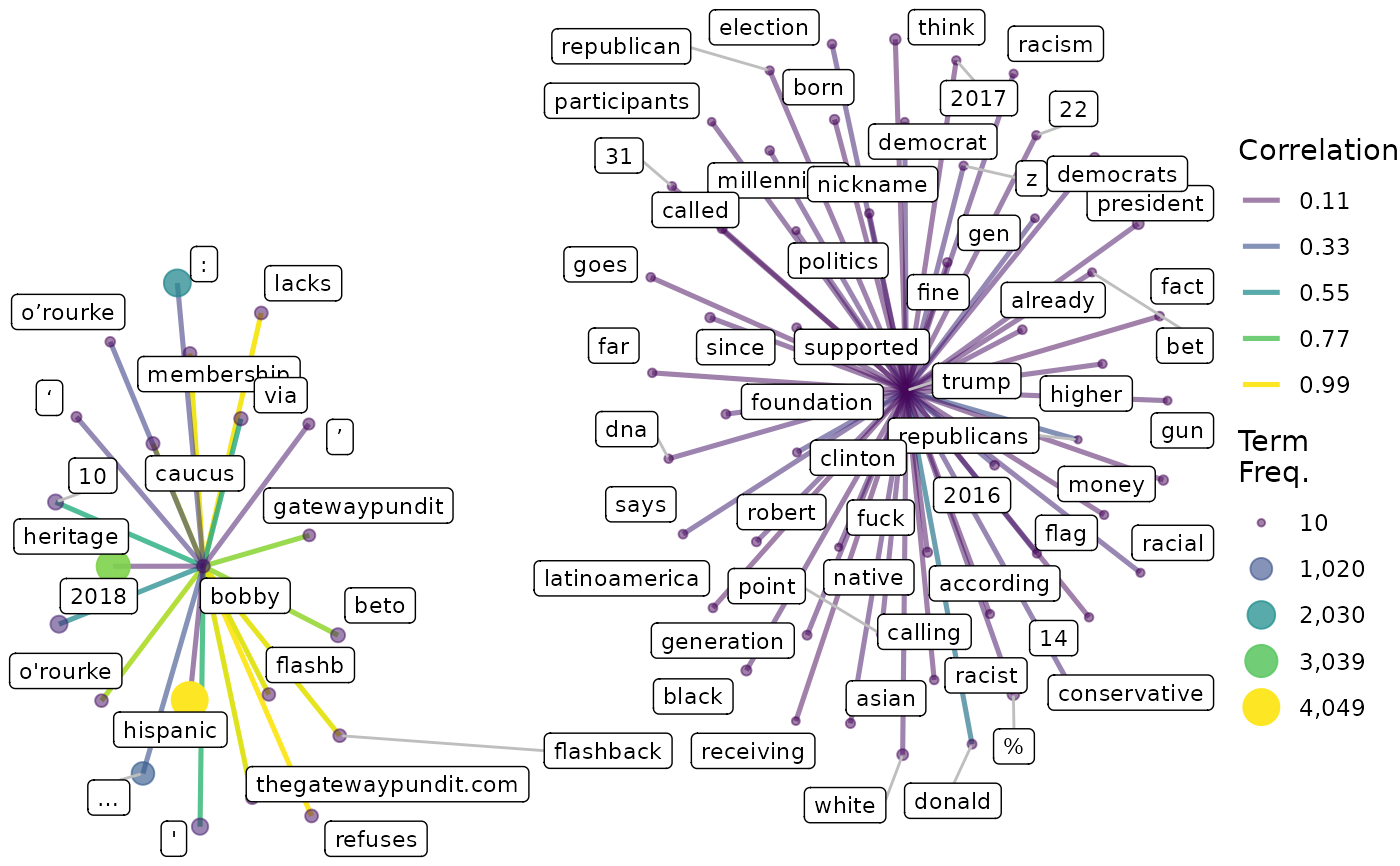
{spinklr_export <- ParseR::sprinklr_export
x <- calculate_corr(
  df = sprinklr_export,
  text_var = Message,
  terms = c("bobby", "trump"),
  min_freq = 10,
  corr_limits = c(-1, 1),
  n_corr = 75,
  hashtags = TRUE,
  mentions = FALSE
)
viz_corr(x$viz)
}