Often, we may want to examine how text differs between all levels of
a group variable in our data set. For example, we may have data that
represents mentions of brands, audiences or are classified by something
such as sentiment/tone. Conveniently, we can do so using the
viz_group_terms_network function of ParseR. The use of
networks are ideal for visualizing relationships between groups in
data.
Here, we’ll run through an example use case for the
viz_group_terms_network function, showcasing how we can
visualize any nuances in text between our groups. In this instance,
we’ll use the sentiment classification of the message variable within
our example data. By doing so, we can see what terms are most likely to
be used in conjunction with each ascribed sentiment class; Negative
Neutral and Positive.
First of all, we want to load in our data and ensure that stop words are removed from the message variable, the aim of doing this is to reduce noise and help surface anything insightful in our data.
# Generate a data sample
set.seed(1)
example <- ParseR::sprinklr_export %>%
  dplyr::slice_sample(n = 1000) %>%
  janitor::clean_names() %>%
  dplyr::mutate(message = tm::removeWords(message, tm::stopwords(kind = "en")))
By making use of arguments such as group_var and
text_var, we can render a basic network. The number of
terms displayed and text size can also be changed depending on user
needs and requirements.
# Important to set seed for consistency across plots rendered
set.seed(12)
example %>%
  ParseR::viz_group_terms_network(group_var =
                                  sentiment, text_var = message,
                                  n_terms = 20, text_size = 2.5,
                                  with_ties = TRUE,
                                  group_colour_map = NULL,
                                  terms_colour = "black",
                                  selected_terms = NULL, selected_terms_colour =  NULL)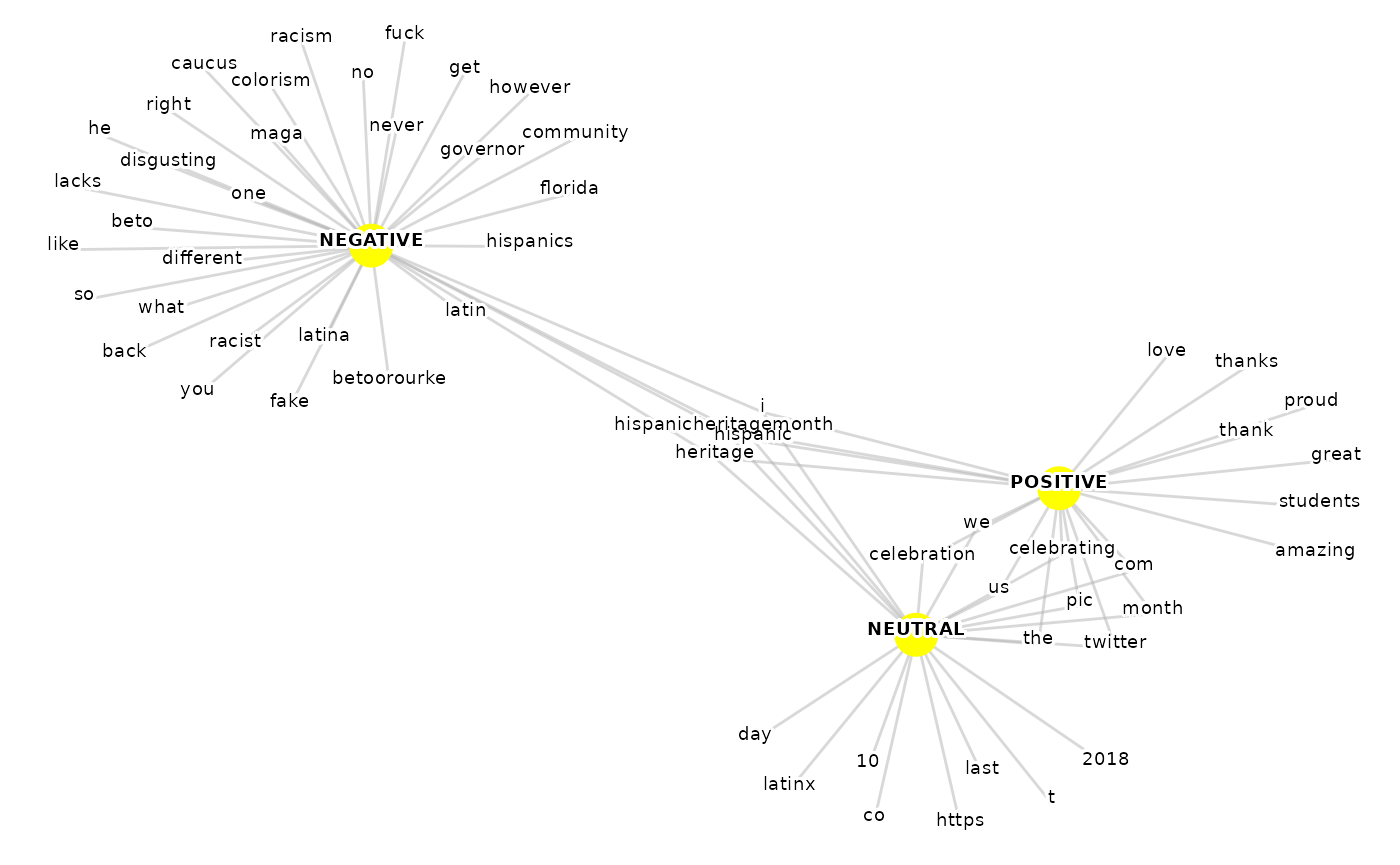
Looking at the initial plot, one of the first things we may feel is
that we want/need to apply an appropriate colour map to our group
variable. We can do so by creating a named vector or character vector
and supplying this to the argument group_colour like
so.
# Define the colour list
sentiment_colours <- c("NEGATIVE" = "#8b0000",
                       "NEUTRAL" = "grey45",
                       "POSITIVE" = "#008b00")

set.seed(12)
example %>%
  ParseR::viz_group_terms_network(group_var = sentiment,
                                  text_var = message,
                                  n_terms = 20,
                                  text_size = 2.5,
                                  with_ties = TRUE,
                                  group_colour = sentiment_colours,
                                  terms_colour = "black",
                                  selected_terms = NULL, selected_terms_colour =  NULL)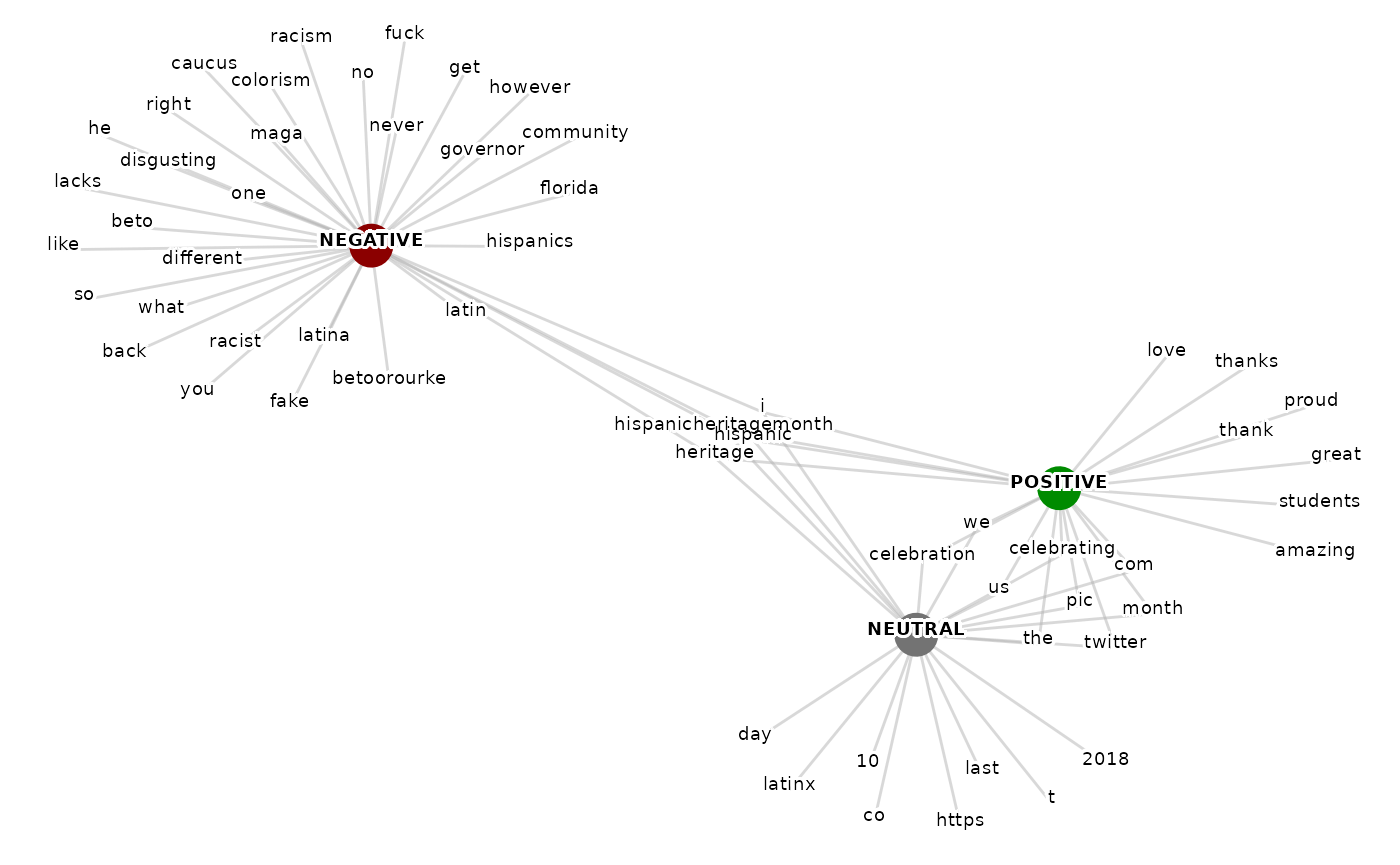
One may also be interested in plucking any terms that prove useful
for storytelling, and applying them with a different colour to help draw
attention to any key insights. Similar to how we have done with the
group variable colour map, we create a list of terms and supply that
list to the selected_terms argument, and then supply the
appropriate colours to both terms_colour and
selected_terms_colour. Note: It’s likely that the user will
want to include each of the group variable names within the terms list
if they wish to reduce visibility of all other terms(using
terms_colour).
# Define any terms we wish to select
selected_terms <- c("NEGATIVE", "NEUTRAL", "POSITIVE", "racism", "disgusting", "colorism", "proud", "love", "amazing", "latino", "latinx", "celebrate")

set.seed(12)
example %>%
  ParseR::viz_group_terms_network(group_var = sentiment,
                                  text_var = message,
                                  n_terms = 20,
                                  text_size = 2.5,
                                  with_ties = TRUE,
                                  group_colour_map = sentiment_colours,
                                  terms_colour = "grey70",
                                  selected_terms = selected_terms,
                                  selected_terms_colour =  "black")
Also, other features of the viz_group_terms_network
function allow the user control over the number of terms to plot by
supplying a value to the n_terms argument as well as the
size of text by using text_size. Although, these two
arguments would be interdependent on one another in terms of the quality
and output of the plot, meaning that if the selected value for
n_terms is high, then it is likely necessary to reduce
text_size accordingly, and vice versa.
set.seed(12)
example %>%
    ParseR::viz_group_terms_network(group_var = sentiment,
                                    text_var =  message,
                                    n_terms = 30,
                                    text_size = 2, with_ties = TRUE,
                                    group_colour = sentiment_colours,
                                    terms_colour = "black",
                                    selected_terms = NULL, selected_terms_colour =  NULL)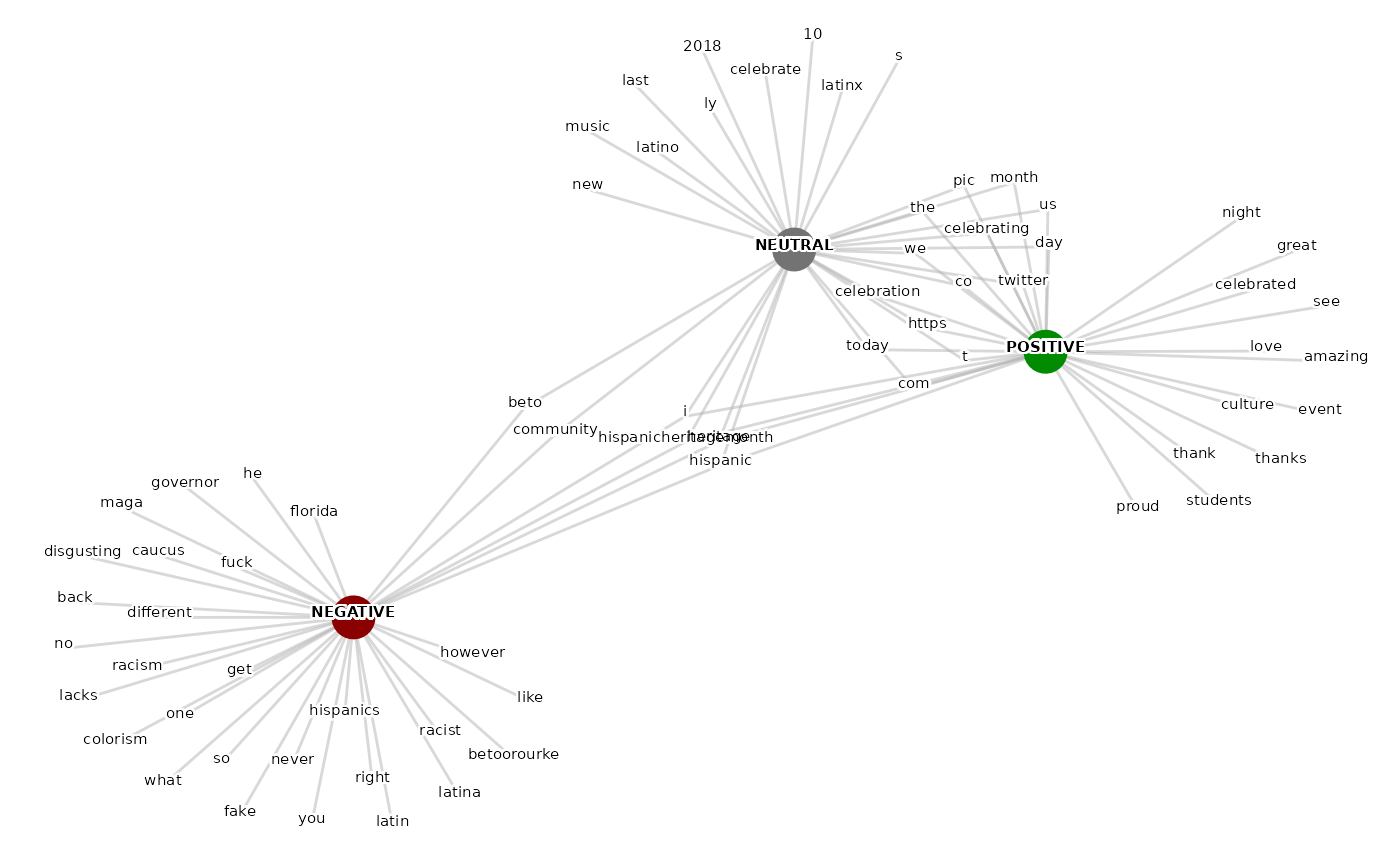
There are some extra arguments which have not yet been covered in entirety, and allow for the user to play around with the output of the visualization. The use of these may depend on the number of groups present in the data, and the amount of information the user may want/need to portray:
-
n_termsThe number of terms that the user wishes to demonstrate per group(if n_terms = 20 there and there are three groups, you will visualize 60 terms in total) . -
text_sizeRepresents the text size of terms and may need to be lowered when the selected value forn_termsis high or there are lots of groups in the data(the plot too busy). -
with_tiesA logical argument(TRUE or FALSE) defining whether to allow for >n_termsif terms have equal frequency ingroup_varcount.