Plots the a tbl_graph object containing ngram counts as a network.
Examples
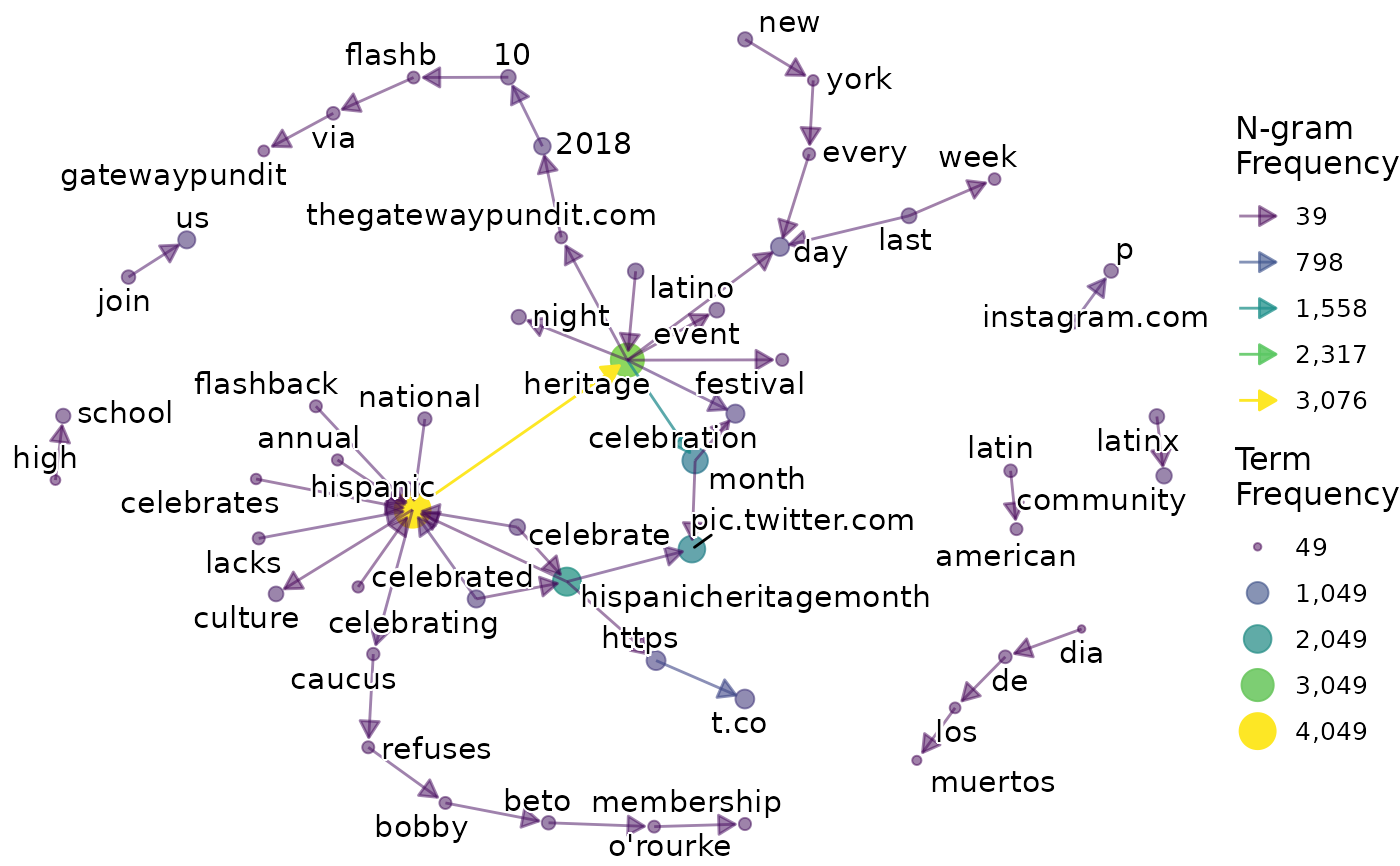
counts <- count_ngram(
  sprinklr_export,
  text_var = Message,
  n = 2,
  top_n = 50
)

viz_ngram(tbl_graph = counts$viz, emphasis = TRUE)
Plots the a tbl_graph object containing ngram counts as a network.
counts <- count_ngram(
sprinklr_export,
text_var = Message,
n = 2,
top_n = 50
)
viz_ngram(tbl_graph = counts$viz, emphasis = TRUE)